머신 러닝에서 performance measurement는 필수다.
특히, Classification task에 대해서, AUC-ROC curve를 통해 성능을 측정할 수 있다.
우리가 multi-class classification problem의 performance를 측정하거나 시각화할 때 AUC(Area Under the Curve) ROC(Receiver Operating Characteristics) 곡선을 사용한다.
이는 모든 classification model의 성능을 확인하기 위한 가장 중요한 evaluation metrics 중 하나.
AUROC(Area Under the Receiver Operating Characteristics) 라고도 한다.
What is the AUC - ROC curve
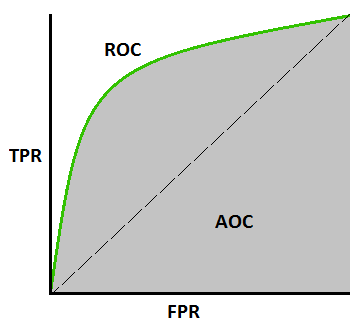
AUC - ROC curve는 다양한 임계값 설정(threshold settings)에서 classification problem의 performance measurement이다.
ROC는 probability curve이고 AUC는 separability의 정도 또는 척도(degree or measure)을 나타낸다.
(여기서 말하는 separability는 클래스간 구분을 잘 하느냐 정도로 이해하면 될듯하다)
AUC가 높을수록 모델이 예측을 더 잘한다.
ROC curve는 FPR(false positive rate)에 대한 TPR(true positive rate)을 표시
(x축 : FPR / y축 : TPR)
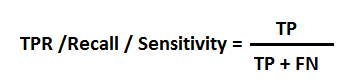
TPR (True Positive Rate) / Recall / Sensitivity
(진짜 양성 비율)
Specificity
(진짜 음성 비율)

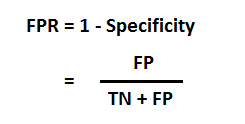
FPR(false positive rate)
(거짓 음성 비율)
Model performance 추측
우수한 모델은 AUC가 1에 가까움으로 separability가 우수.
열악한 모델은 AUC가 0에 가까움으로 separability가 열악.
AUC가 0.5이면 모델에 class 분리 capacity가 전혀 없음을 의미
ROC는 확률 곡선. 해당 확률 분포를 뿌려보자
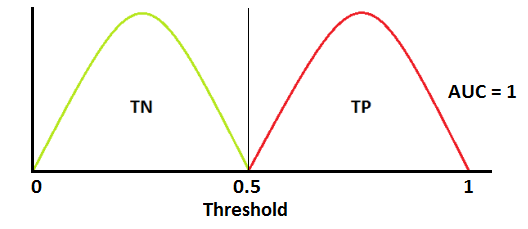

(빨간색 분포 곡선 : 양성 / 녹색 분포 곡선 : 음성)
이것은 이상적인 현상이다.
두 곡선이 전혀 겹치지 않으면 이상적인 separability를 측정할 수 있다.
positive class와 negative class를 완벽하게 구분 가능
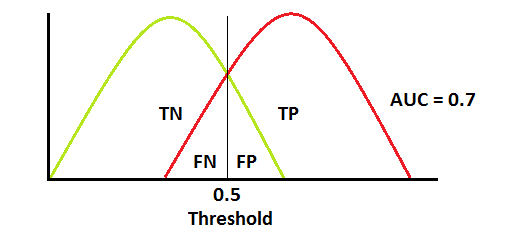

두 분포가 겹치게 되면 type 1 error(false positive)와 type 2 error(fasle negative) 오류가 발생한다.
threshold에 따라, 이를 minimize하거나 maximize할 수 있다.
AUC가 0.7이면 모델이 positive class와 negative class를 구분할 수 있는 확률이 70%임을 의미

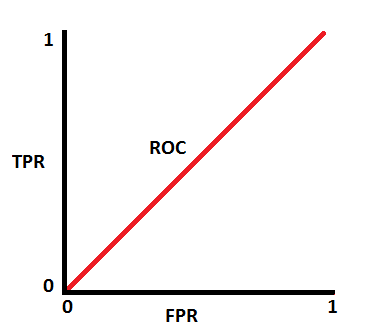
최악의 상황.
AUC가 약 0.5일 때 모델은 positive class와 negative class를 구별하는 판별 능력이 없음.
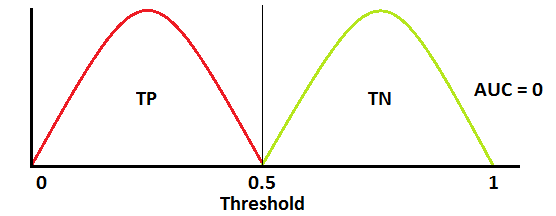

AUC가 약 0일 때 모델은 클래스를 반대로 예측하고 하고 있음.
모델이 네거티브 클래스를 포지티브 클래스로 예측하고 그 반대의 경우도 마찬가지
Sensitivity, Specificity, FPR, Threshold 사이의 관계
Sensitivity와 specificity는 반비례
(Sensitivity⬆️, Specificity⬇️ / Sensitivity⬇️, Specificity⬆️)
Threshold를 낮추면⬇️ 더 많은 positive class를 얻게 됨으로 sensitivity는 증가하고⬆️, specificity는 감소한다.⬇️
Threshold를 높이면⬆️ 더 많은 negative class를 얻게 됨으로 sensitivity는 감소하고⬇️, specificity는 증가한다.⬆️
FPR은 1 - specificity.따라서 TPR을 높이면⬆️ FPR 증가하고⬆️ , TPR을 낮추면 ⬇️ FPR도 감소한다⬇️
Multi-class model에 대한 AUC ROC cuve
다중 클래스 모델에서 One vs ALL 방법론을 사용하여 N개의 클래스에 대한 N개의 AUC ROC 곡선을 그릴 수 있음.
예를 들어, 개, 고양이, 소라는 세 개의 클래스가 있는 경우,
1. 개 vs (고양이, 소)
2. 고양이 vs (개, 소)
3. 소 vs (개, 고양이)
이런식으로 3개의 ROC curve를 그릴 수 있다.
참고
https://towardsdatascience.com/understanding-auc-roc-curve-68b2303cc9c5
Understanding AUC - ROC Curve
In Machine Learning, performance measurement is an essential task. So when it comes to a classification problem, we can count on an AUC - ROC Curve. When we need to check or visualize the performance…
towardsdatascience.com
'딥러닝관련 > 기초 이론' 카테고리의 다른 글
| Cross entropy loss 정리 (0) | 2022.03.06 |
|---|---|
| 소프트맥스 회귀(softmax regression) (0) | 2022.03.06 |
| 로지스틱 회귀(logistic regression) (0) | 2022.03.02 |
| 규제가 있는 선형 모델 (0) | 2022.02.27 |
| 편향/분산 트레이드 오프 (Bias/variance trade-off) (0) | 2022.02.27 |


